
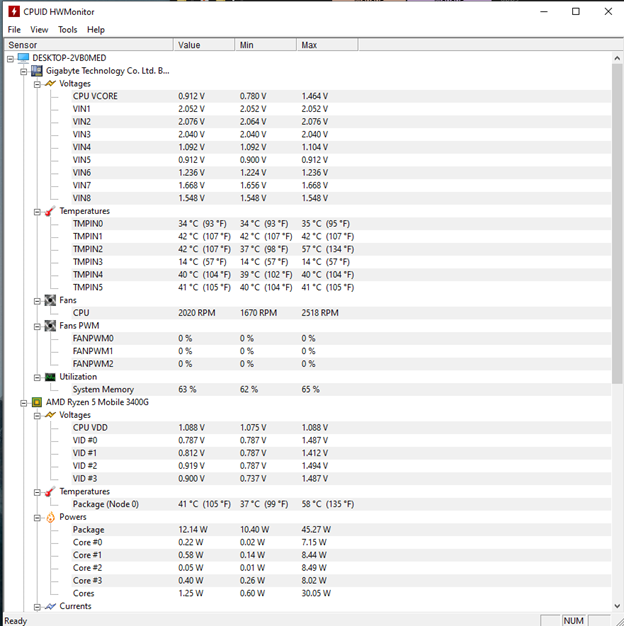
HWMonitor is a freeware hardware monitoring program from CPUID for the PC that is capable of reading the voltage, temperature, and fan speed (displayed as RPM). The program is capable of handling most common sensor chips, can read modern CPU’s on-die core thermal sensors, hard drive S.M.A.R.T, and even the video card GPU temperature. The picture below is an example of the CPUID HWMonitor screen and output. The current value, and the recorded minimum and maximum values, are listed in the chart.
How to check your CPU temperature using HWMonitor?
Install HWMonitor on the computer
Process install HWMonitor It is also relatively simple because the software is small, and doesn’t have too many settings.
Step 1: Download the latest version of HWMonitor software to the device.
Step 2: Open the file install HWMonitor just load, right click and select Run as administrator to proceed with the installation.
Step 3: Choose Browse … to set HWMonitor installation directory on your device, then press next.
Step 4: Similarly, you also press select Browse … to set HWMonitor installation directory at Start Menu. Press next to go to the next step.
Step 5: Check the item Create a desktop icon then press next to agree to create a shortcut for the software on the desktop.
Step 6: Check the selected settings again. Press Install, the system will automatically install HWMonitor on the device.
Step 7: After the installation is complete, the system will appear a message as shown below. You press finish to close the notification window and conduct the software experience.
Check CPU temperature using HWMonitor
Step 1: Open HWMonitor software on the computer.
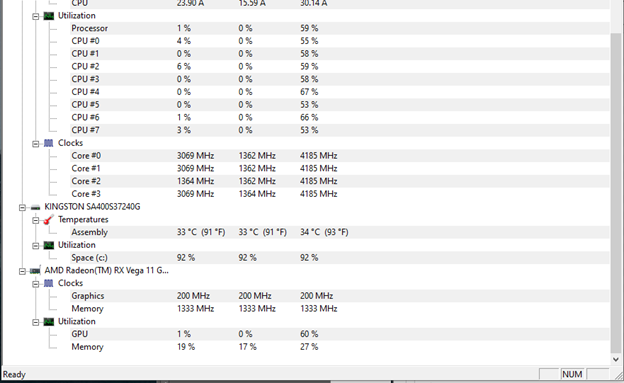
Step 2: The working window of HWMonitor is quite simple, divided into sections as shown below, including:
– Main computer
– The computer’s CPU
– Your computer’s hard drive
– Graphics card of the computer
Depending on the device hardware configuration, HWMonitor will display more items.
Step 3: To check the CPU temperature using HWMonitor, double-click the item of the computer.
Step 4: Go to the directory Temperatures (Temperature) and see the information in the sections Package, Core # 0 and Core # 1The metrics are divided into 3 columns: Value – present value, Min – Lowest value and Max – Highest value.
–
Package: Place indicates the general temperature of
the CPU
– Core # 0
and Core # 1: Are 2 physical characters of the CPU. (If the CPU has 4
software cores, it will display Core # 2, Core # 3.)
You can also change how many degrees Fahrenheit to understand and better understand the CPU temperature situation if you are not familiar with degrees Celsius and vice versa.
Reference: