Ever felt your Excel spreadsheets lacked personality? Yearning for a visual punch that goes beyond simple text and numbers? Look no further than color-coded dropdown lists! This nifty trick adds a pop of color and clarity to your data, making it easier to understand and analyze. So grab your mouse, and let’s dive into the world of vibrant dropdowns!
Step 1: Creating the Dropdown List
Select the cells where you want the dropdown list to appear.
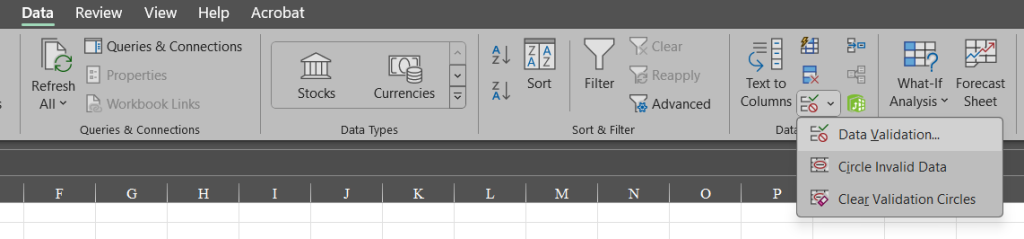
Head to the Data tab on the ribbon.
Click Data Validation.
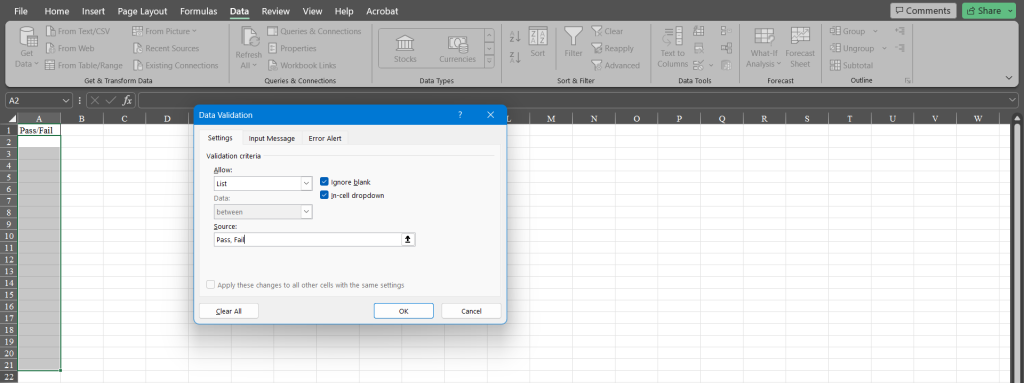
Under Settings, choose List from the Allow dropdown.
In the Source box, type your dropdown options separated by commas (e.g., “Pass”, “Fail”).
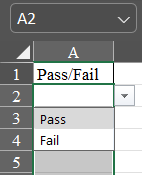
Click OK. And, voila! You now have a functional dropdown list in your cells.
Step 2: Adding the Color Magic
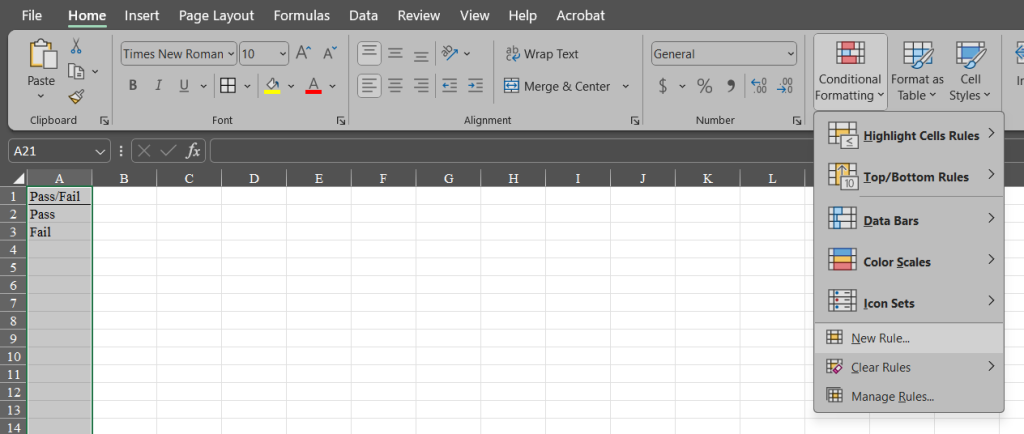
Navigate to the Home tab on the ribbon.
Click Conditional Formatting.
Choose New Rule.
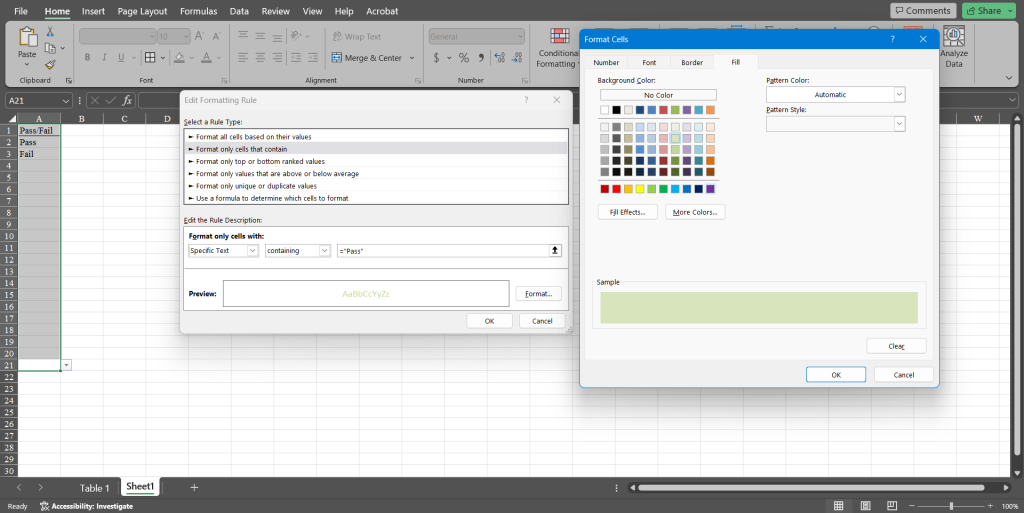
Select Format only cells that contain.
In the next dropdown, choose Specific Text.
After selecting the Specific Text from the dropdown under ‘Format only cells with button’, type your desired condition (e.g., “Pass”) on the last text box.
Then, click Format.
Go to the Fill tab and pick your color for this condition (e.g., green for “Pass”).
Click OK twice.
Lastly, repeat steps 5-9 for other conditions (e.g., “Fail” with red fill).
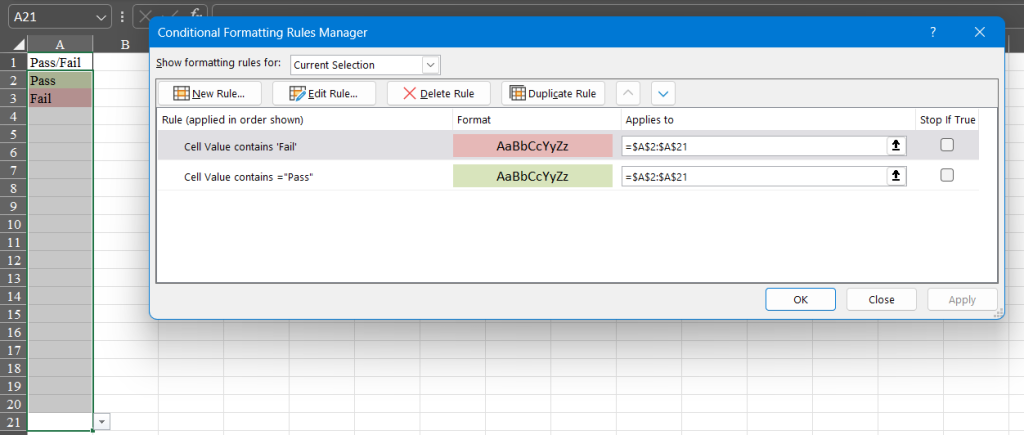
Step 3: Managing Your Colorful Rules
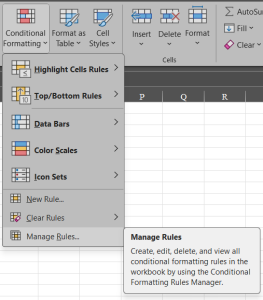
Go back to Conditional Formatting.
Click Manage Rules.
You can see all your rules here, edit their cell ranges, adjust conditions, or even delete or duplicate them.
Now you have a dynamic, color-coded dropdown list! This makes data entry and analysis more intuitive, especially for large datasets. Plus, it adds a touch of fun to your spreadsheets, impressing colleagues and clients alike.
Remember:
Use colors that represent your data clearly and meaningfully.
Don’t go overboard with too many colors – keep it visually balanced.
Experiment and have fun!
So, let your creativity loose and transform your Excel spreadsheets into colorful masterpieces. With color-coded dropdown lists, data analysis becomes not just productive but visually appealing too!